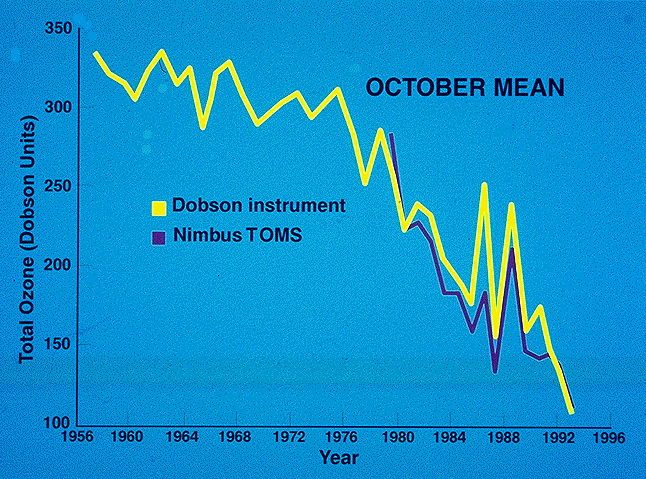
In 1985, after almost 30 years of measurements from the Antarctic continent,
Joseph Farman and his colleagues from the British
Antarctic Survey reported that in recent years the ozone overhead
was significantly reduced relative to previous years during the month of
October. 
These measurements used an intrument called a "Dobson Spectrometer",
a device that records the total ozone amount between the ground and space.
The result is what is called the "column ozone", because it represents
the total number of ozone molecules in the column of air, not a concentration
or a mixing ratio. If we compress the ozone in the column overhead into
a box of the same area, and remove all the other gases (primarily nitrogen
and oxygen), it would be about 3 millimeters thick. We call this "300 Dobson
Units". For more information on Dobson Units, see TOMS
web page ).
Normally, the stratosphere is about 280-350 DU (dobson units) thick,
depending on season and location. Values as high as 500 DU are sometimes
found near the north pole where the ozone layer is thicker (the tropopause
is lower in altitude because air is descending at the poles in the lower
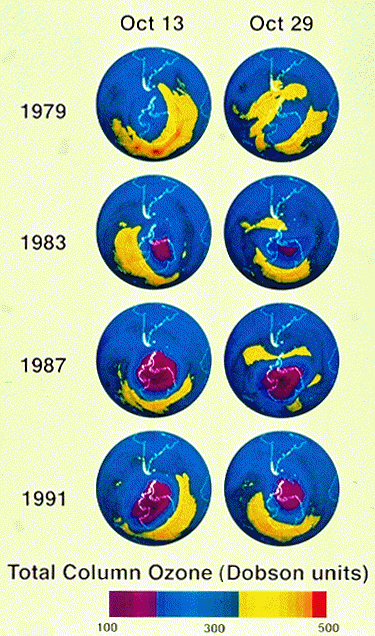
stratosphere in winter). Subsequent analysis of ozone data from the TOMS
(Total Ozone Mapping Spectrometer) instrument in orbit around the earth
on the Nimbus 7 satellite showed that this ozone loss was spread over an
area the size of the entire Antarctic continent. The figure below shows
the measurements of ozone from TOMS dating back to 1979. As you can see,
the ozone hole wasn't as severe in 1979, although it was somewhat apparent
even then.
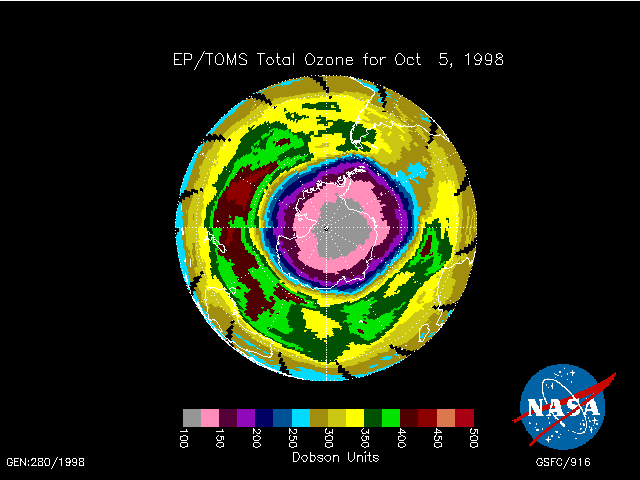
The 1998 ozone hole (shown below) was the largest on record. The pink
and grey colors represent regiosn where about 2/3 of the ozone has been
destroyed. This region is nearly centered over the pole in September/October.
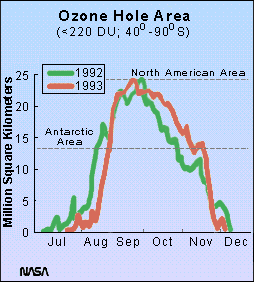
Continuous satellite monitoring of the region shows that the drop in ozone abundances occurs in late August and September, at a time when the air over Antarctica is coldest and the sun returns to the region. By 1992 the area of the ozone hole was nearly equal to the area of the United States (note, however, that by December, the ozone hole is gone!).
It wasn't long before other scientists proposed that the ozone hole
was caused by a series of chemical reactions that only occured in the cold
air over Antarctica. In particular, below temperatures of 200 K, water,
sulfuric acid, and nitric acid freeze to form tiny (diameters of 10^-6
meters) particles that look like "haze". These particles serve as catalytic
surfaces to convert HCl and ClONO2, reservoirs of chlorine, into chlorine
gas (Cl2), a compound that readily breaks apart into chlorine atoms in
weak sunlight. HCl and ClONO2 are very stable in sunlight, so that the
net effect of this new brand of chemistry (called "heterogeneous" chemistry,
because it involves a gas reacting on a liquid or solid surface) is to
convert unreactive forms of chlorine into chlorine atoms, which catalytically
destroy ozone. We call these clouds of particles "polar stratospheric clouds",
or PSCs.
When Cl2 breaks apart, the chlorine atoms that are produced react rapidly with ozone to form ClO, the "smoking gun" of ozone depletion. From space, with the proper detector, this "bloom" of ClO in springtime is quite obvious, as shown in the Figure below. And, as you can see, the ozone loss occurs whereever the ClO is high. This is due to the following catalytic reactions, which are somewhat different than those occurring at mid-latitudes, although the end result, destruction of ozone, is the same.
ClO + ClO -> Cl2O2
Cl2O2 + hv -> Cl + Cl + O2
2x[Cl + O3 -> ClO + O2]
net: O3 + O3 -> 3 O2
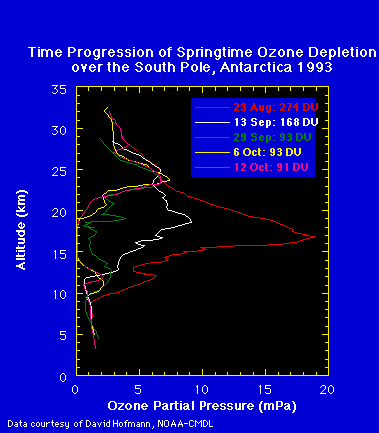
This ozone loss occurs in a region where polar stratospheric clouds
(PSCs) form during the cold winter months (May-September). These clouds
appear between 14 and 20 km, and the figure below shows that this is precisely
where ozone disappears between the months of August and October.
Ozone loss has also been observed in the Arctic stratosphere in winter. Although there are important differences between the antarctic and arctic regions, apparently, the similarities are important. Not as much ozone is lost over the arctic, but more people live in the northern hemisphere. Thus, ozone loss there has commanded more attention recently than that over the Antarctic. The figure below shows that ClO abundances are high over the arctic in winter, and similar catalytic ozone destruction can occur. In addition, a reaction with bromine becomes more important in the arctic (because of the warmer temperatures in the arctic).
ClO + BrO -> Cl + Br + O2
Cl + O3 -> ClO + O2
Br + O3 -> BrO + O2
net: O3 + O3 -> 2 O2
The ClO + ClO reaction accounts for about 60% of the ozone
loss over the arctic, whereas the BrO + ClO reaction accounts
for about 30-35%. The remainder is due to the catalytic cycle proposed
by Cicerone and Stolarski for ozone loss at mid-latitudes. Over Antarctic,
it has been shown that removal of all the bromine in the stratosphere would
have little effect on the ozone hole. Essentially, all of the ozone in
the air between 14 and 20 km is destroyed, with or without bromine. As
abundances of chlorine in the stratosphere decrease, this situation will
change, and ultimately, bromine will become more important on a relative
basis.