Due: Feb 8: This assignment reviews lectures prior to and including Feb 1.
Use diagrams in your answers wherever possible. A picture tells a thousand words.
1. Which of the following statements relate more to weather and which relate to climate?
If the statement tells you ANYTHING about the atmosphere over a time scale longer than two weeks, the statement is one relating to climate.
a) The summers here are warm and humid. Climate
b) Cumulus clouds presently cover the entire sky. Weather
c) Our lowest temperature in Boulder last winter was on 13th January, and was -12oF. Climate (it tells you that the other days during the season were warmer than -12F)
d) The air temperature outside is 21oC. Weather
e) In Boulder, December is our windiest month. Climate
f) Snow is falling at the rate of 5 cm per hour. Weather
g) The average temperature for the month of September in Boulder is 62oF. Climate
h) Summers in Boulder have many thundershowers during El Niño years. Climate
(16 points)
There are several answers for this. Life
can impact climate by changing the chemical composition of the atmosphere
(e.g. CO2), by
altering reflection from the surface (e.g.
the Daisyworld), or by modifying the hydrologic cycle by retaining and
transpiring water. An example of life stabilizing climate was shown in
the Daisyworld at low temperatures, where the population of reflective
daisies increased with temperature. Other stabilizing impacts involving
life are possible. The feedback in which life is involved must be negative
however.
b) List some ways in which life may actually cause climate to become less stable. (5 pts)
Life was shown to make climate less stable
in the Daisyworld at high temperatures, where the number of reflective
daisies
decreased as temperature increased. This led
to more sunlight absorbed by the Earth and even higher temperatures. Other
destabilizing effects of life are possible.The
feedback in which life is involved must be positive however.
c) What proof exists for the Gaia hypothesis and is the evidence strong? Construct a critical assessment of the evidence which is presented in the text (p16-17). In that answer you should cite caveats to the Gaia hypothesis if they exist. (10 pts)
The Gaia hypothesis asserts that life regulates the Earth's climate so as to continue its survival and optimize its environmental conditions. The theory is compelling however it probably overstates the role that life can play in influencing climate. As was seen in the Daisyworld, life in simple system is unable to optimize conditions and in some cases it can destabilize the system (as in 2b). Also, it is unclear how an intelligent collective response from the biosphere can be orchestrated from such a large number of independent beings. (your comments may vary but should be in line with those from the text.)
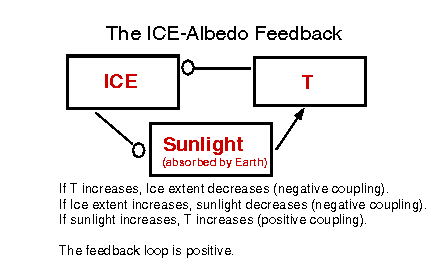
3. In class we discussed an imaginary world called the Daisyworld where the presence of daisies influenced climate. For the problems below construct an analogous world made only of ice and water. [FYI, the albedo of ice is much greater than for water. ]
a) Under the assumption that the planet has only one temperature
for everything on its surface, consider the stability of the planet's climate.
Draw the systems description of the components. Assume initially that the
sun is very weak and becomes more strong with time (like Fig. 1-13 in the
text). What would be the corresponding plots of "the effect of changes
in ice coverage on temperature" and "the effect of temperature changes
on ice coverage" (as on p 19 of the text)? How would you characterize the
stability of the planet's climate? (10 pts)
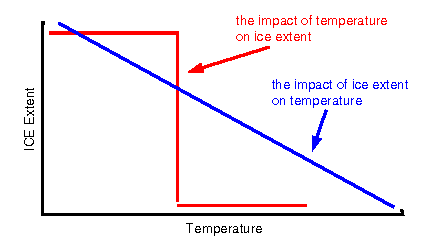  |
To solve for the "impact of temperature on ice" graph we need
to solve for the amount of ice coverage (0 to 100%) as we change temperature.
Since the entire surface of the planet is at a single temperature (let's
call it T) the planet will be all ice for T<0oC and all water
for T>0oC. Only at T=0oC can both phases exist.
To solve for the impact of "ice on temperature" graph we need to solve for the temperature of the planet as we change the amount of ice on its surface (from 0% to 100%). This is identical to the daisyworld problem in the text, except rather than daisies, we are using ice. With no ice, the temperature of the planet is high. With lots of ice the temperature of the planet is low. The blue curve to the left reflects this. Now, to establish the couplings for a warming Earth we need to remember that the nature of the coupling can be a function of T as was found in the Daisyworld. Since ice amount does not change as T changes for T<0oC, there is no coupling. Similarly there is no coupling for T>0oC. Only at 0oC is there a coupling and it described at left. At T=0, the climate is unstable because the feedback loop is positive. |
b) Now, allow temperature to vary with latitude as it
does on Earth so that a fraction of the surface may be covered with ice
(and a fraction with water) at any one time. Reconstruct the above system
description and plots. Assume the climate is in equilibrium at a state
in which the planet is partially covered with ice. Is the state stable
or unstable? (15 pts)
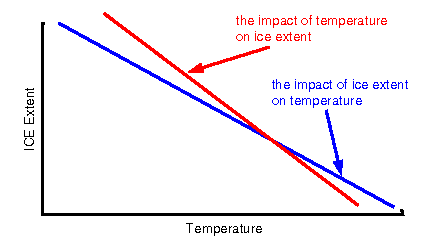  |
To solve for the "impact of temperature on ice" graph we need
to solve for the amount of ice coverage (0 to 100%) as we change temperature.
Unlike before, one part of the planet can be covered by liquid water while
the other is covered by ice. At the coolest temperatures, the planet will
be all ice. At the warmest temperatures the planet will be all water. (If
you have some region where the curve "flattens out" at each end, that is
OK too.)
To solve for the impact of "ice on temperature" graph we need to solve for the temperature of the planet as we change the amount of ice on its surface (from 0% to 100%). This is again identical to the daisyworld problem in the text, except rather than daisies, we are using ice. With no ice, the temperature of the planet is high. With lots of ice the temperature of the planet is low. The blue curve to the left reflects this. However you draw the two lines is OK so long as they are decreasing as T increases. The problem gives no indication as to whether the lines intersect. The couplings shown to the left are valid for all T, except for T warmer than the T where only water exists and T colder than the T where only ice exists, in which case there are no couplings. For such temperature, the climate is unstable because the feedback loop is unstable. |
c) Add clouds to the climate system in (b) and assume
they increase in coverage with temperature and have the same albedo as
ice. Reconstruct the systems description and plots. Assume there is no
direct association between clouds and ice, only the indirect association
through temperature. Is the system stability increased or decreased by
considering clouds? (10 pts)
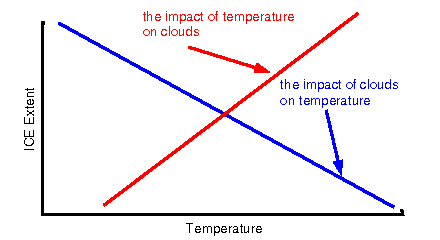 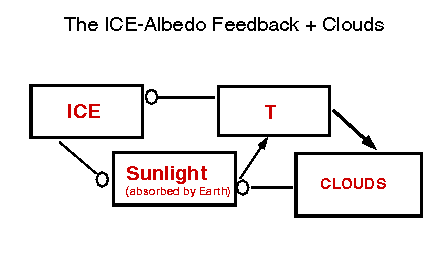 |
The "impact of clouds on temperature" graph will be the same as for
the "impact of ice on temperature graph (above) since clouds have the same
albedo as ice.
The "impact of temperature on clouds" can be found in the first part of the question where it states that clouds increase with temperature so the coupling is positive. Since clouds reflect sunlight, if they increase in coverage the sunlight absorbed by Earth will decrease. The coupling is negative. As before, if the amount of sunlight increases, the temperature will increase so the coupling is positive. Since the new feedback loop (clouds, T, sunlight) is negative, it adds stability to the climate. |
4. In class we discussed some of the factors which modify the Earth's radiative balance including clouds, water vapor, and surface properties.
a) Using what you know about the role of these substances
on Earth, speculate on how the radiative balance of Mars may be different
than Earth. Assume that Mars has no clouds, oceans, or water vapor and
a much more reflective surface. Simply, comment on the changes in each
flux shown in Fig 3-19. Make the assumption that the surface of Mars is
colder and drier than on Earth but has the same emissivity. If there are
fluxes that cannot be deduced based on what you know, simply state that
you don't know the change. (15 pts)
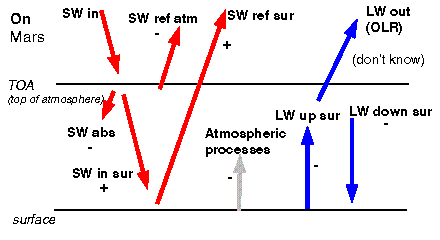 |
On Mars, for every 100 units of radiation which enters the atmosphere, less will be absorbed or reflected by the atmosphere than on Earth since there are fewer clouds and less water vapor. Since less is absorbed or reflected by the atmosphere, more gets to the surface. Since the surface is drier and colder, sensible and latent heat fluxes (atmospheric processes) are less. Also, since the surface is colder, less longwave flux is emitted by the surface. Fewer clouds and less water vapor exist so the greenhouse effect (LW down sur) is less. You don't know if OLR is greater or less than on Earth since both the LW up from the surface and the greenhouse effect decrease but there is nothing to tell you which decreases more. |
b) Now consider Venus, where clouds and water vapor are
much more prevalent than on Earth and the surface is very absorptive (not
reflective). How would flux components in Fig. 3-19 change ? Make the assumption
that the surface of Venus is warmer and wetter than on Earth but has the
same emissivity. Again, if there are components you don't know, simply
state that. (15 pts)
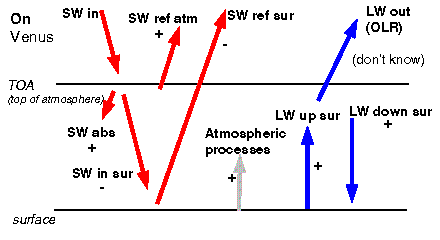 |
On Venus, for every 100 units of radiation which enters the atmosphere, more will be absorbed or reflected by the atmosphere than on Earth since there are more clouds and more water vapor. Since more is absorbed and reflected by the atmosphere, less gets to the surface. Since the surface is wetter and warmer, sensible and latent heat fluxes (atmospheric processes) are more. Also, since the surface is warmer, more longwave flux is emitted by the surface. More clouds and more water vapor exist so the greenhouse effect (LW down sur) is greater. You don't know if OLR is greater or less than on Earth since both the LW up from the surface and the greenhouse effect increase but there is nothing to tell you which increases more. |