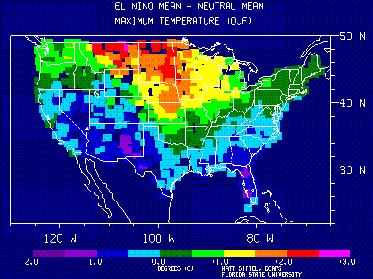
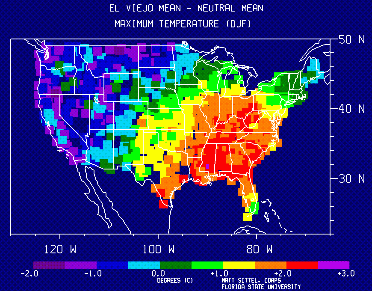
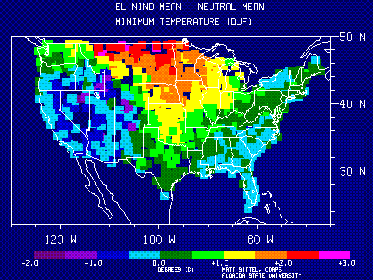
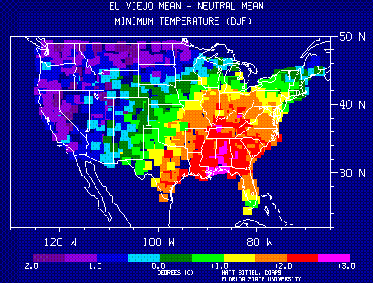
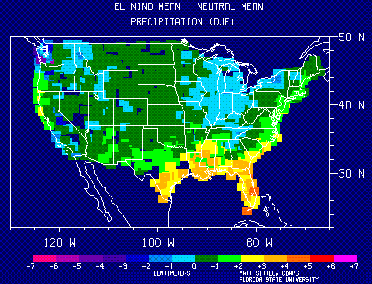
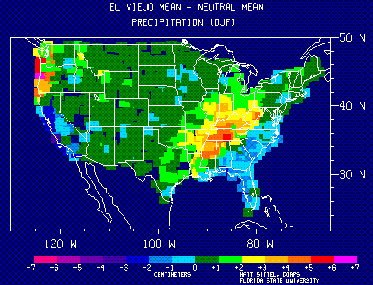
Each of the 40 years in the research period (1948 to 1987) is classified as an El Niño year, an El Viejo year, or neither (a "neutral" year) based on sea surface temperature data in the eastern and central equatorial Pacific provided by the Japan Meteorological Agency. The climate data, consisting of monthly average daily maximum temperature, monthly average daily minimum temperature, and average total monthly precipitation, are taken from the HCN Serial Temperature and Precipitation Data from the National Climatic Data Center, distributed through Oak Ridge National Laboratories. Stations with no missing data during the 40-year research period are used, and a total of over 1,000 stations are used to make each of these plots.
The observed climate data for each "ENSO year" (defined as running from October through September) are placed into one of the three ENSO categories. The mean of each of these three categories is determined for each of the three studied climate variables during the three-month winter season, and the differences between the ENSO extremes and the neutral case for maximum temperature, minimum temperature, and precipitation are illustrated in these plots.


